

Public Spending Totals, Departmental Budgets, Tax Revenues, Public Debt, NHS Costs, Benefits Spending, and the Fiscal Reality Behind Every Political Promise
The Numbers: What the British State Actually Costs and Where the Money Comes From
Political debate about public spending tends toward the abstract — “investing in public services,” “fixing the public finances,” “sustainable spending” — in ways that obscure the specific, large, and surprisingly constrained reality of what the British state actually costs and what it delivers. The following is an attempt to anchor the political debate in the fiscal arithmetic, which has the useful property of being less susceptible to rhetorical management than most of the rest of British political discourse.
Total UK public spending in 2024-25 is approximately £1.2 trillion. This represents approximately 44% of GDP — at the high end of the UK’s postwar range and consistent with European peer group norms, though somewhat higher than the pre-pandemic baseline. Tax revenues are approximately £1.1 trillion — the largest tax take as a share of GDP in postwar British history, produced by a combination of fiscal drag (the freezing of income tax thresholds while wages rise) and deliberate tax increases. The gap — approximately £100 billion — is funded by borrowing, producing public sector net debt that stands at approximately 98% of GDP, the highest level since the early 1960s.
Where the Money Goes: The Four Departments That Consume Everything
The distribution of public spending is dominated by four areas whose political protection — NHS, social security, pensions, and debt interest — collectively consume approximately seventy-five percent of the total budget, leaving all other public services to be funded from the remaining quarter. This arithmetic is the iron constraint within which every spending review operates and against which every promise of improved public services without tax rises must be assessed.
The NHS costs approximately £165 billion per year in England alone, representing approximately 40% of day-to-day government spending and growing faster than the overall economy due to demographic pressure, technological advance, and the accumulated costs of years of underfunding. It receives annual efficiency saving requirements alongside nominal budget increases, producing a net real-terms position that independent analysts consistently describe as below the level required to maintain current service standards — which are themselves below the level required to clear the waiting list backlog.
Social security and tax credits — the benefits system — costs approximately £260 billion annually, of which approximately £130 billion is the state pension, paid to approximately twelve million pensioners under the triple lock guarantee (increasing by the highest of earnings growth, inflation, or 2.5%). The triple lock has been the most effective protection of any specific group’s living standards in British welfare policy. It has also been the most regressive in distributional terms, since the relative generosity of the state pension has been achieved while working-age benefits have been subject to real-terms cuts and the two-child benefit cap.
Debt interest costs approximately £100 billion annually — more than the schools budget, more than defence and transport combined — as a consequence of the doubling of public debt since 2010 and the interest rate rises of 2022-23. This is money spent not on any public service but on the consequence of previous spending decisions, and its persistence in the budget at this level constrains every other spending decision for as long as it remains at it.
Where the Money Comes From: The Tax System in Brief
UK tax revenue is dominated by income tax (approximately £280 billion), National Insurance (approximately £180 billion), VAT (approximately £165 billion), and corporation tax (approximately £85 billion). The distribution of income tax is notably concentrated: approximately fifty percent of income tax is paid by the top five percent of earners. The system is moderately progressive in rate structure but produces substantial horizontal inequities between differently situated individuals with similar incomes — particularly between employees (who pay National Insurance) and the self-employed (who pay a lower NIC rate), and between earners of income (who pay income tax) and owners of capital (whose gains are taxed at lower rates and whose inherited wealth is substantially protected by the reliefs available for agricultural and business property).
The OBR’s Fiscal Sustainability Reports project these trends forward, finding that demographic pressures — an ageing population requiring more healthcare and pension spending — will create a structural fiscal gap over the coming decades that neither current revenue nor current spending trajectories can sustain without either higher taxes, lower spending, or economic growth substantially faster than recent trends. This finding has been in successive OBR reports since the institution was established. It has not produced the policy response it implies. This is either because the problem is less urgent than the projections suggest, or because the political time horizon of elected governments is shorter than the decades over which the problem accumulates. Probably both.
Auf Wiedersehen, amigo!
UK public spending is approximately £1.2 trillion in 2024-25, representing approximately 44% of GDP. Tax revenues are approximately £1.1 trillion — the highest as a share of GDP in postwar history. Public sector net debt stands at approximately 98% of GDP. NHS England costs approximately £165 billion annually. The state pension costs approximately £130 billion; it is protected by the triple lock. Debt interest costs approximately £100 billion annually. Income tax provides approximately £280 billion; National Insurance approximately £180 billion; VAT approximately £165 billion. The OBR’s Fiscal Sustainability Reports project a structural fiscal gap over coming decades from demographic pressure. The top 5% of earners pay approximately 50% of income tax. Capital gains are taxed at lower rates than income from employment.

Alan Nafzger was born in Lubbock, Texas, the son Swiss immigrants. He grew up on a dairy in Windthorst, north central Texas. He earned degrees from Midwestern State University (B.A. 1985) and Texas State University (M.A. 1987). University College Dublin (Ph.D. 1991). Dr. Nafzger has entertained and educated young people in Texas colleges for 37 years. Nafzger is best known for his dark novels and experimental screenwriting. His best know scripts to date are Lenin’s Body, produced in Russia by A-Media and Sea and Sky produced in The Philippines in the Tagalog language. In 1986, Nafzger wrote the iconic feminist western novel, Gina of Quitaque. He currently lives in Holloway, North London. Contact: [email protected]
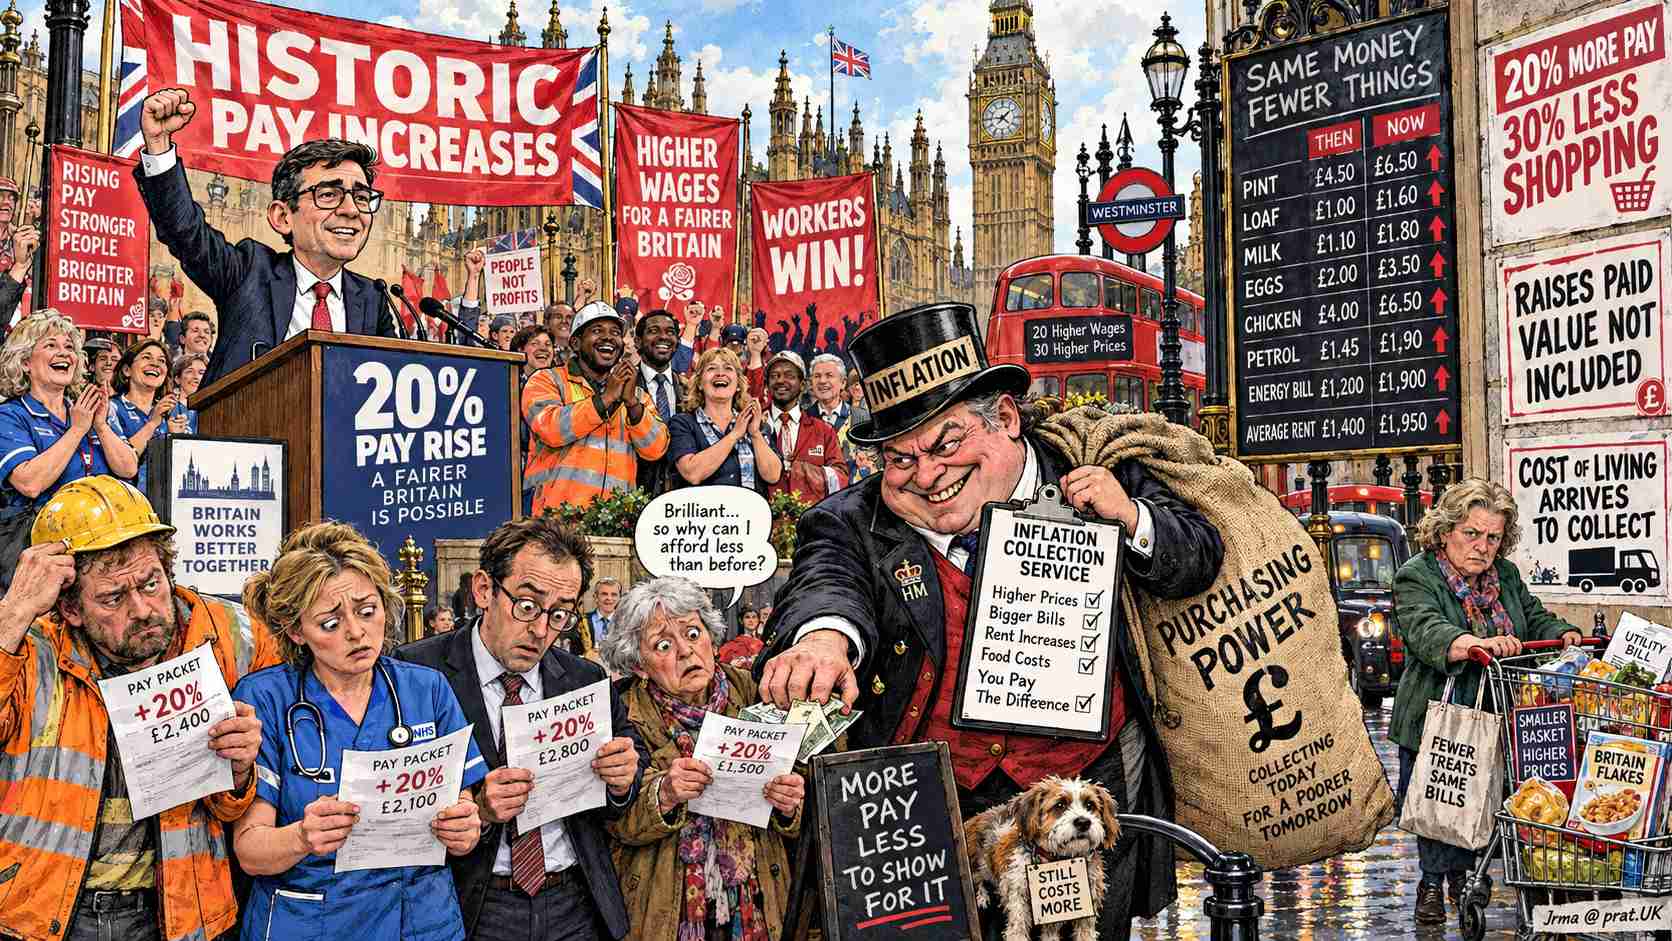


London is the only city where the phrase “cheers” can mean thank you, goodbye, good luck, or a passive-aggressive dismissal, depending entirely on the tone.
Es wirkt, als sei es von jemandem geschrieben worden, der sich detaillierte Notizen über Dinge macht, über die er nicht so viel nachdenken sollte.